Summarizing Data
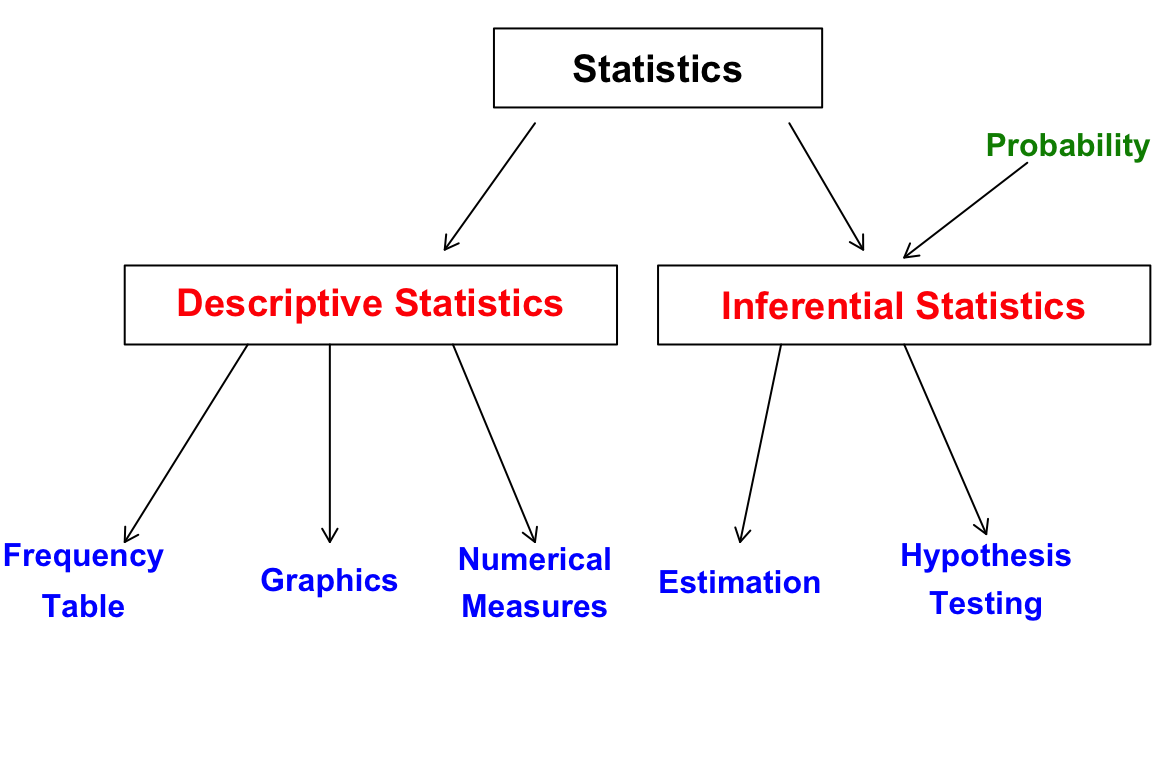
Statistics can be divided into two parts: descriptive statistics and inferential statistics (statistical inference). Before doing inferential statistics, we usually learn to understand our data because we cannot use appropriate methods, do the analysis and interpret the result correctly without fully understanding our data. Descriptive statistics discusses how to describe and summarize data by frequency/count tables, graphics/visualization or some important numerical measures.
This Part is about descriptive statistics. We learn frequency tables and basic data visualization in 5 Data Visualization and numerical measures in 6 Numerical Measures of Data. You may already learned descriptive statistics in your elementary, middle or high school. If yes, this Part is more like a review. But the difference is that you will learn how to use R to describe and plot your data.