1 Science of Data and Data Science
1.1 What is Statistics?
The first question we ask in this book is “What is Statistics?”
Statistics can be defined in a variety of ways, and there doesn’t seem to be one definition that describes it best. For our purposes, statistics can be generally divided into two overarching categories: - Statistics as a set of numeric records - Statistics as a discipline
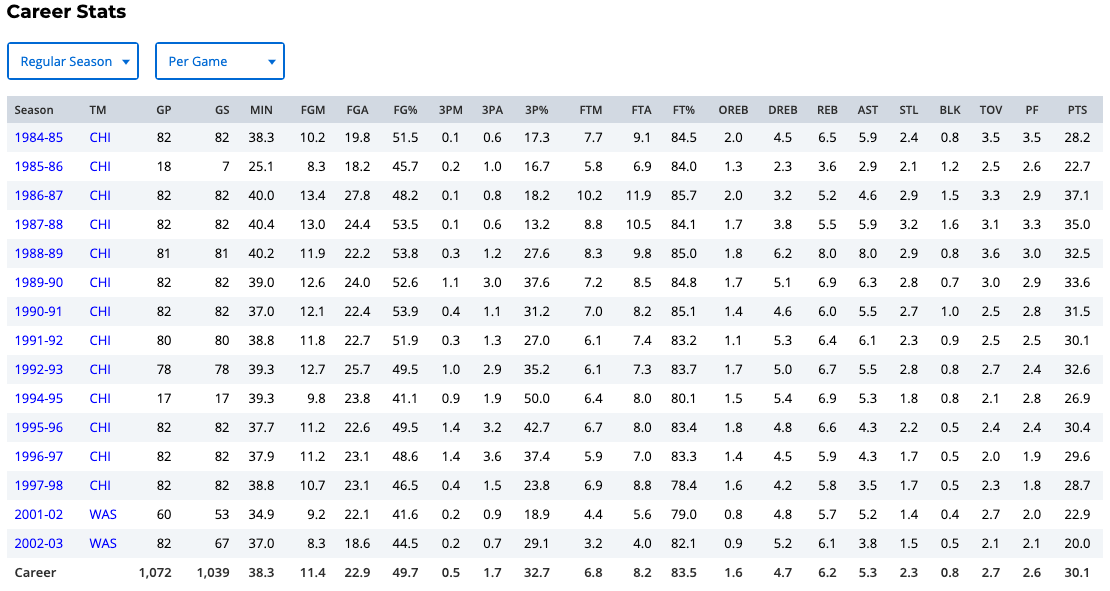
Statistics as a Set of Numeric Records
In ordinary conversations, the word statistics is used as a term to indicate a set or collection of numeric records. For example, Figure 1.1 below shows Michael Jordan’s career statistics from his time in the NBA. However, this is just one way of defining statistics.
Statistics as a Discipline
As previously stated, other definitions of statistics exist including the one shown in Figure 1.2.
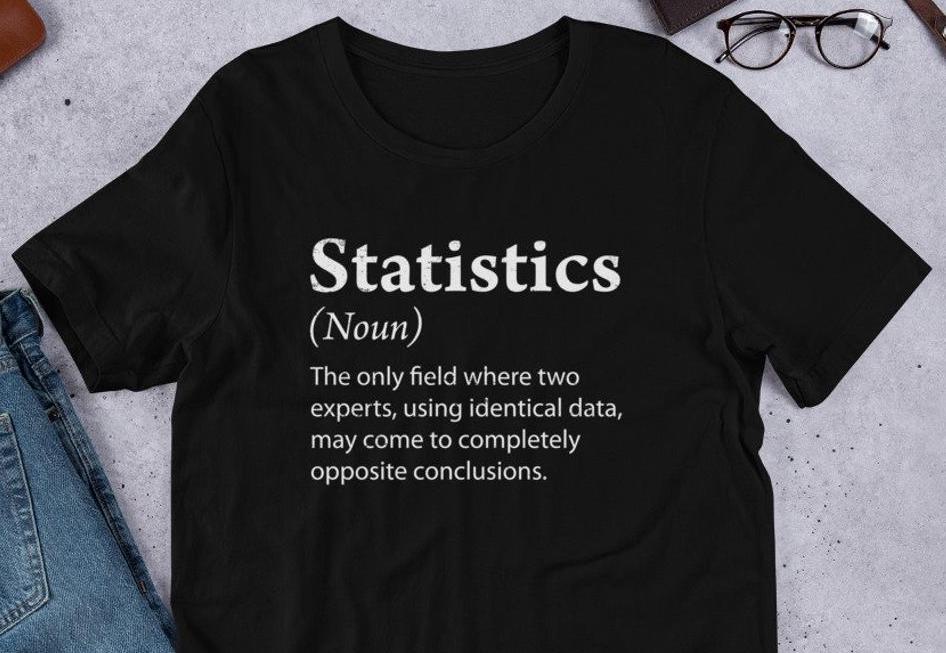
This definition emphasizes the idea that with the same data, different statistical methods may produce different results and lead to different conclusions. This is true in some sense, and later we’ll see why in the book.
Forget about that useless definition. Wiki lists a more formal definition of statistics in Figure 1.3 below.
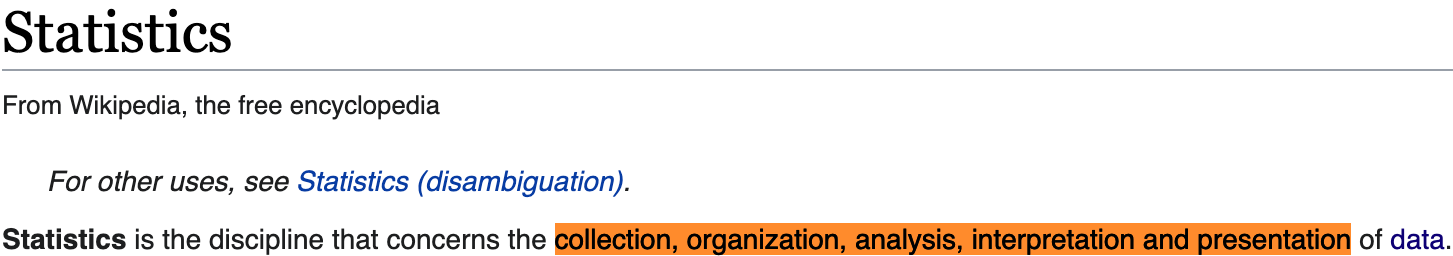
Statistics is the discipline that concerns the collection, organization, analysis, interpretation, and presentation of data. Without doubt, Statistics is a discipline dealing with data. Being viewed as a field or branch of mathematics, Statistics is a Science of Data. I am not saying statistics is THE science of data. There might be another science of data. Statistics is a science of data that uses statistical thinking, methods and models.
1.2 Difference between Statistics and Data Science
Data Science
Because of their shared attributes, many find it hard to differentiate between statistics and data science. The tweets below poke fun at the lack of clarity surrounding the definition of data science/data scientists (Figure 1.6).


A more formal definition of data science can be found on Investopedia. This site defines Data Science as a field of applied mathematics and statistics that provides useful information based on large amounts of complex data or big data. Although this definition is helpful for understanding data science, Dan Ariely, a famous behavioral economist at Duke, joked about their use of the term big data in his tweet below (Figure 1.7).

More information can be gathered about the differences between these two fields from looking at the courses offered in the Statistics Department at UC Santa Cruz, my alma mater. From Figure 1.8 below, one can see that statistics primarily focuses on data analysis, methods and models.
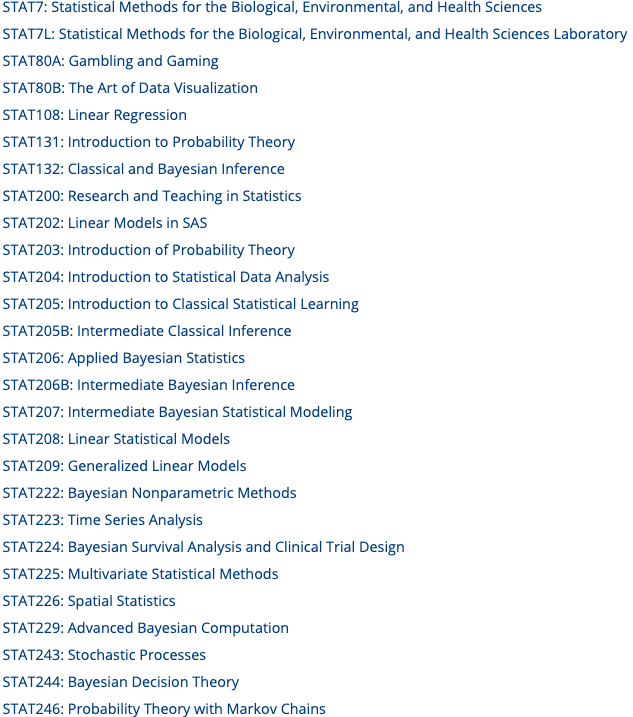
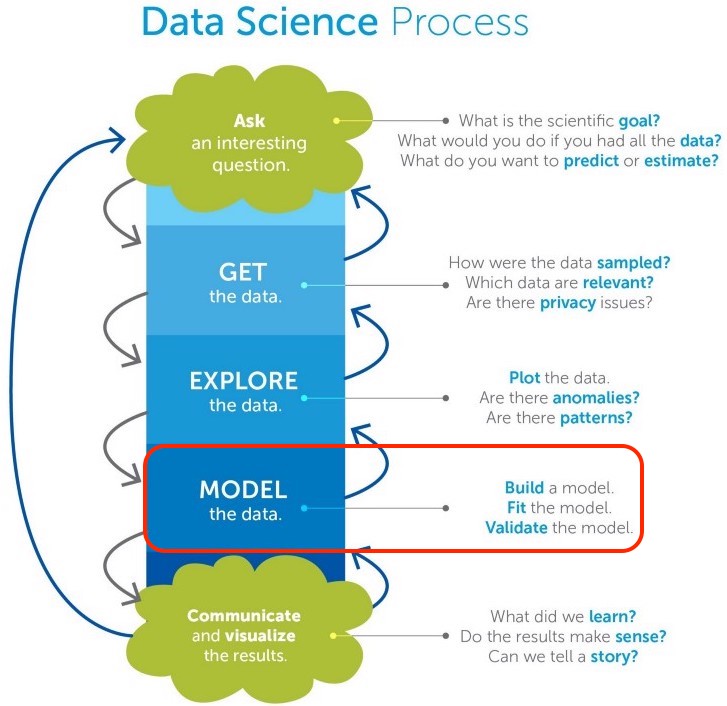
This statistics department, in particular, doesn’t talk a lot about data collection, organization, data presentation or data visualization. In typical statistics departments, there isn’t much instruction or research done on data collection, cleaning, storage, database management, and data visualization. Because statistics continues to focus on data analysis and modeling, Data Science now addresses these other processes that statistics passes over. The data science process includes the collection, organization, analysis, interpretation and presentation of data (Figure 1.9). Although statistics does not focus on these concepts, they are encompassed within the field of data science.
1.3 What Will We Learn In this Course?
Below the main topics of this book are listed in the order in which they will be covered.
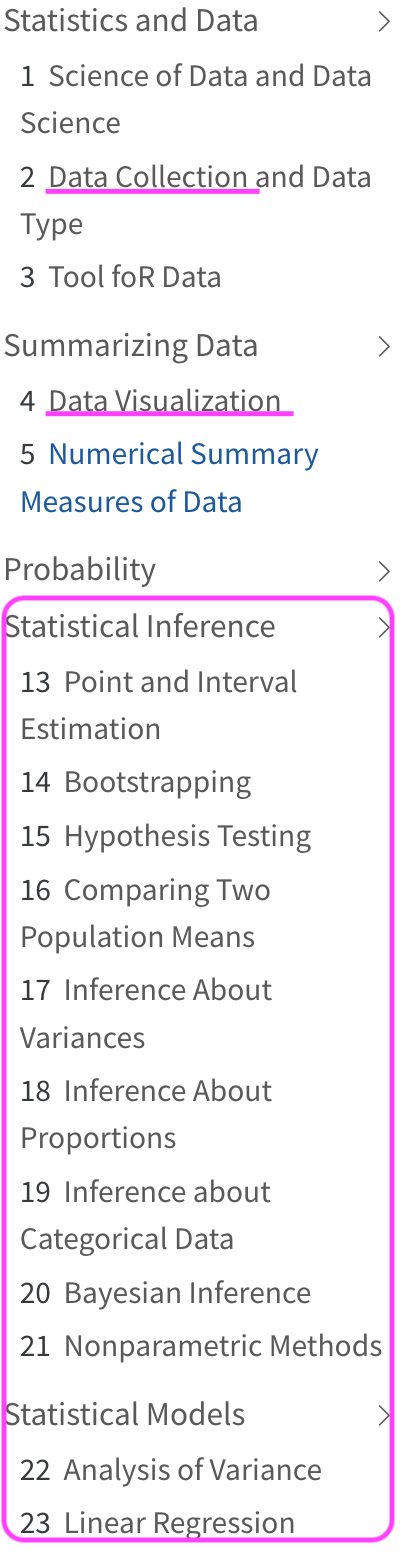
We do touch data collection and data visualization and data summary, but we will spend most of our time talking about probability and statistical inference methods that are circled on the list above. This book focuses on the statistical methods for analyzing data.
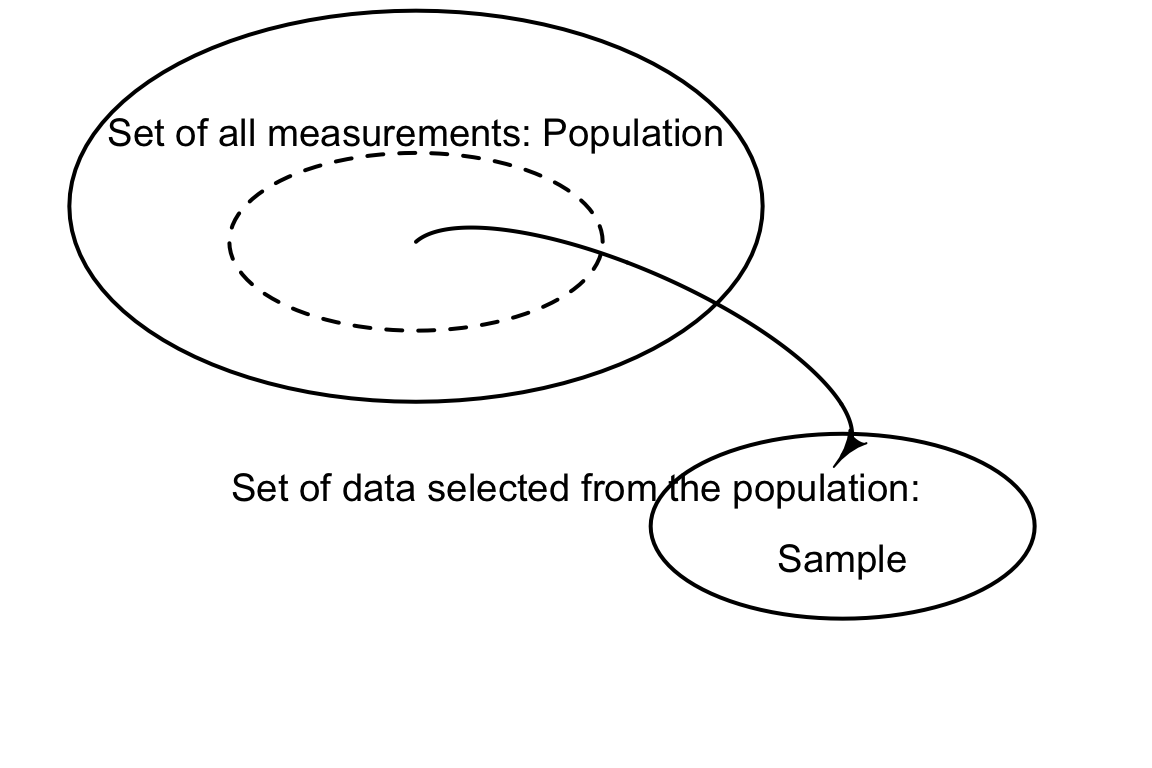
In summary, we will learn useful information
about the population we are interested in
from our sample data
through statistical inferential methods, including estimation and testing
Don’t worry if you have no idea of these terms. These are what we will discuss throughout the book, and I’ll explain each term in detail.